By Marone: December 2019
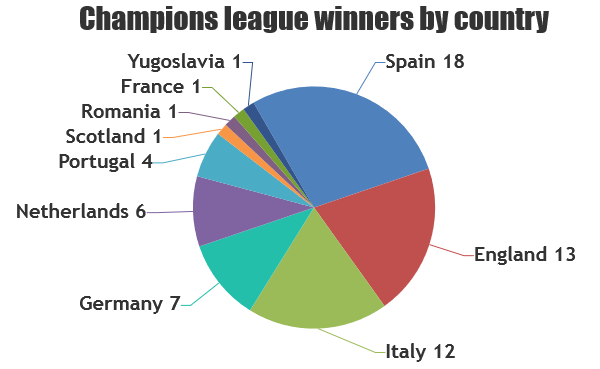
Visualize champions league winners
Goal
This article describes how to make diagrams and charts about champions league competition.Used technologies
CanvasjsMaven 3.2
VSCODE as IDE
Json Data
The json file contains a list of clubs, each club consists of: name, founding year, the number of won competitions and the country
Html page
Javascript file
Notes:
- Transform the data to a map, the map contains the country name and the won number
- The map will sorted based on the value of won number
Pie diagram

References
The complete code can be found in GitHub